np.log1p와 np.expm1, Feature Engineering, 희소값 탐색
지난 포스팅에서 이어짐
추가 분석 및 시각화
# season은 실제로 보면 분기로 되어있다.
sns.barplot(data = train, x = "season", y ="count", hue = "year")

지난 시간에 month를 시각화 했을 때, YoY로 비교시 큰 차이가 보이지 않아서 제외를 했었다. 그렇다면, 연-월을 같이 묶어서 plot하면 어떤 변화가 있는지 확인을 해보자.
# datetime을 슬라이싱해서 year-month column을 생성

train["year-month"] = train["datetime"].astype(str).str[:7]
test["year-month"] = test["datetime"].astype(str).str[:7]

# plot
plt.figure(figsize = (24,3))
sns.barplot(data = train, x = "year-month", y = "count")

묶은 연월을 모델이 인식할 수 있게 인코딩을 하도록 하자.
# one-hot-encoding => pd.get_dummies(), 순서가 없는 데이터에 인코딩
# ordinal-encoding => category 데이터타입으로 변경하면 ordinal encoding을 할 수 있다.
#                    순서가 있는 데이터에 인코딩

train["year-month-code"] = train["year-month"].astype("category").cat.codes
test["year-month-code"] = test["year-month"].astype("category").cat.codes
그리고 해당 컬럼을 추가한 피처로 학습을 진행하고 케글에 제출까지 해보았다.(자세한 내용은 지난 내용 참고)

지난번에 제출했던 0.43399점 보다 점수가 떨어졌다(해당 경진대회는 점수가 낮을 수록 높은 순위를 기록한다). year-month column은 오히려 예측이 더 떨어지는 것을 확인 할 수 있다.
❗casual과 Registered의 의미
지난 시간에 Casual과 Registered에 대한 의미를 다음에 알아보자고 언급했었다. casual은 비회원, Registered은 회원을 뜻하며, 회원 + 비회원은 count가 된다. 때문에 둘은 count와 겹치기 때문에 전처리단계에서 제외를 했었다. label에 회원으로 학습하고 예측 + label에 비회원으로 학습하고 예측을 한다면 제출 예측값이 될 것이다. 회원과 비회원을 따로 예측해서 더해주면 스코어가 약간 더 올라갈 수 있다.
np.log1p와 np.expm1를 활용하여 모델구축, 예측 및 학습 진행하기
데이터 호출
매번 경로를 입력하는 것은 수고롭기 때문에 경로를 설정해주는 명령어를 할당한다.
base_path = "data/bike/"
train = pd.read_csv(f"{base_path}/train.csv")
test = pd.read_csv(f"{base_path}/test.csv")
💡 경로에 대한 팁
상대경로는 현재 경로를 기준으로 하는 경로 예) ./ 현재경로를 의미합니다. ../ 상위 경로를 의미합니다. 절대경로는 전체 경로를 다 지정하는 경로 예) 윈도우 C: 부터 시작하는 경로입니다. 현재 경로에서 ./ 쓰는 것과 아무것도 안 쓰는것과 같은 위치를 나타냅니다.
전처리
지난 시간과 같이 datetime을 연,월,일,시간으로 나눠주도록 한다.
train["datetime"] = pd.to_datetime(train["datetime"])

train["year"] = train["datetime"].dt.year
train["month"] = train["datetime"].dt.month
train["day"] = train["datetime"].dt.day
train["hour"] = train["datetime"].dt.hour
train["minute"] = train["datetime"].dt.minute
train["second"] = train["datetime"].dt.second
train["dayofweek"] = train["datetime"].dt.dayofweek

# 잘 진행되었는지 확인을 하도록 한다.
print(train.shape)
train[['datetime', 'year', 'month',
       'day', 'hour','minute',
       'second', "dayofweek"]].head()
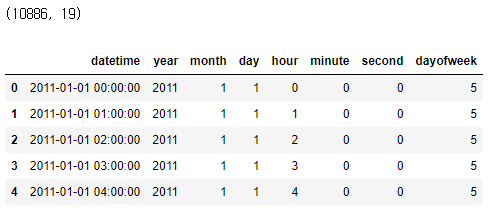
test도 마찬가지로 동일하게 진행해준다.
test["year"] = test["datetime"].dt.year
test["month"] = test["datetime"].dt.month
test["day"] = test["datetime"].dt.day
test["hour"] = test["datetime"].dt.hour
test["minute"] = test["datetime"].dt.minute
test["second"] = test["datetime"].dt.second
test["dayofweek"] = test["datetime"].dt.dayofweek

print(test.shape)
test[['datetime', 'year', 'month',
       'day', 'hour','minute',
       'second', 'dayofweek']].head()
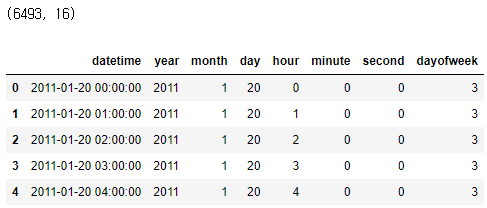
지난 내용을 확인하면 다른점이 한 가지 있는 것을 확인 할 수 있다. 바로 dayofweek항목이 추가되었다. dt 접근자에서 제공하는 기능 덕에 일일이 함수를 입력하지 않아도 된다. 요일이 중요한 역할을 하기에 추가하도록 한다.
EDA
KDE plot에 log를 취하는 이유?
- log를 count값에 적용하게 되면 한쪽에 너무 뾰족하게 있던 분포가 좀 더 완만한 분포가 된다.
- 데이터에 따라 치우치고(skewed) 뾰족한 분포가 정규분포에 가까워지기도 한다.
- log를 취한 값을 사용하게 되면 이상치에도 덜 민감하게 된다.
정규분포를 만드는 이유?
- 머신러닝이나 딥러닝에 좋은 성능을 내준다.
- 값을 볼 때 한쪽에 너무 치우쳐져 있고 뾰족하다면 특성을 제대로 학습하기가 어렵기 때문에 정규분포로 되어 있다면 특성을 고르게 학습할 수 있는 효과를 볼 수 있다.
fig, axes = plt.subplots(nrows = 1, ncols = 2, figsize = (12,3))

# count - kdeplot
sns.kdeplot(train["count"], ax = axes[0])

# count log1p - kdeplot
# log1p : log에 1을 더해주는 기능. 1을 더해주는 이유는 log에 들어가는 값이 (-)이면 y값이 음수로 무한대로 가기 때문.
#         train["count_log1p"] = np.log(train["count"] + 1)
sns.kdeplot(np.log1p(train["count"]), ax = axes[1])

로그함수를 취한 값을 column에 넣어주도록 한다.
train["count_log1p"] = np.log(train["count"]+1)
그리고 지수함수를 취했을 때의 값도 column에 넣어주고 잘 적용되었는지 확인한다.
💡 로그함수와 지수함수 tip
- np.exp 는 지수함수.
- np.log로 로그를 취했던 값을 다시 원래의 값으로 복원할 수 있다.
- log를 취할 때는 1을 더하고 로그를 취했는데 지수함수를 적용할 때는 반대의 순서대로 복원해야 순서가 맞는다.
- np.exp로 지수함수를 적용하고 -1 을 해주어야 로그를 취했던 순서를 복원해 주게 된다.
- np.expm1은 지수함수를 적용하고 -1을 해주는 순서로 되어있다.
count == np.expm1(np.log1p())같은 값이다.
train["count_expm1"] = np.exp(train["count_log1p"]) - 1
train[["count", "count_log1p", "count_expm1"]]
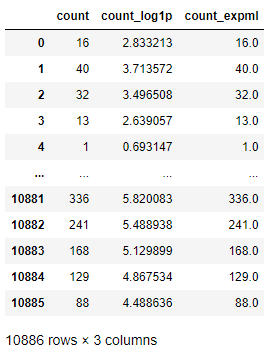
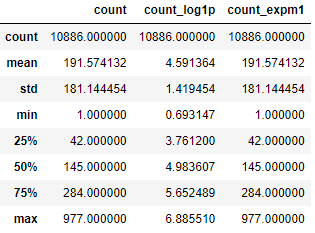
"count_log1p"에서 로그처리되었던 값이, "count_expml"의 지수함수처리로 값이 복원된 것을 확인 할 수 있다.
# count, log1p, expm1
fig, axes = plt.subplots(nrows = 1, ncols = 3, figsize = (12,3))

# count - kdeplot
sns.kdeplot(train["count"], ax = axes[0])
# count log1p - kdeplot
sns.kdeplot(train["count_log1p"], ax = axes[1])
# count expm1 - kdeplot
sns.kdeplot(train["count_expm1"], ax = axes[2])

describe 값도 확인해보록 하자.
train[["count", "count_log1p", "count_expm1"]].describe()
🤔 왜 count에 log를 취하고 다시 지수함수로 복원하였나?
- log 값으로 변환시켜 정규분포에 가까운 형태로 만들어 예측하여 머신러닝의 기능을 향상시키고, log 형태로 나온 예측값을 복원하기 위해
학습, 예측 데이터셋 만들기
학습과 예측 데이터셋을 만들도록 하자.
label_name = "count_log1p"
feature_names = ['holiday', 'workingday', 'weather', 'temp',
       'atemp', 'humidity', 'windspeed','year','hour','dayofweek']

X_train = train[feature_names]
X_test = test[feature_names]
y_train = train[label_name]
머신러닝 알고리즘
회귀유형이기에 RandomForestRegressor를 사용하도록 하자.
from sklearn.ensemble import RandomForestRegressor

model = RandomForestRegressor(random_state= 42, n_jobs = -1)
하이퍼파라미터 설정
from sklearn.model_selection import RandomizedSearchCV

param_distributions = {"max_depth" : np.random.randint(3, 10, 10),
                       "max_features" : np.random.uniform(0, 1, 10)}

reg = RandomizedSearchCV(model, param_distributions = param_distributions
                         , n_iter = 10, cv = 5,
                         verbose = 2, n_jobs = -1, random_state = 42,
                         scoring = "neg_root_mean_squared_error" )

reg.fit(X_train, y_train)
score를 neg_root_mean_squared_error로 사용하는 이유는 count값에 이미 log를 취해서이다. 따라서 다른 회귀분석값 중 안정적인 성능을 내는 RMSE를 사용하도록 한다.
reg.best_estimator_
결과값 : RandomForestRegressor(max_depth=9, max_features=0.9133520295351394, n_jobs=-1,
                      random_state=42)

reg.best_score_
결과값 : -0.5233237452230891
결과값이 음수로 나오는 이유는 neg_root_mean_squared_error 의 기능이다. 확실하지는 않지만, 아마도 정렬을 위해 앞에 음수를 붙혀준게 아닐까 싶다. 위 결과값의 절대값을 취하면 RMSLE 값이 된다.
rmsle = abs(reg.best_score_)
랜덤서치로 찾은 최적의 값을 모델로 설정한 뒤, 학습을 진행한다.
best_model = reg.best_estimator_
그리고 평가를 위해서 cross_val_predict도 계산해주도록 하자.
from sklearn.model_selection import cross_val_predict

y_valid_pred = cross_val_predict(best_model, X_train, y_train, cv=5, n_jobs=-1,verbose=2)
평가
평가 수식에 대한 포스팅은 차후에 업로드 될 예정이다. 업로드가 되면 해당자리에 넘어갈 수 있는 링크를 걸어두도록 하겠다.
# MSE
from sklearn.metrics import mean_squared_error

mean_squared_error(y_train, y_valid_pred)
결과값 : 0.29679788125210566

# RMSE
mean_squared_error(y_train, y_valid_pred) ** (0.5)
학습과 예측
RandomSearchCV를 통해서 찾은 최적의 파라미터값이 적용된 모델에 학습을 시키고 예측을 진행시켰다.
y_predict = best_model.fit(X_train, y_train).predict(X_test)
우리가 구한 y_predict 예측 값은 원활한 학습과정을 위해 log 처리를 한 수치를 바탕으로 학습하고 예측한 값이기 때문에 지수함수처리np.exp1를 해서 원래 수로 변환시켜 count값에 적용시켜야 한다.
y_exp = np.expm1(y_predict)
제출
지난 시간과 동일하기 때문에 생략하도록 하겠다.

RandomSearchCV를 두번을 시행하고 각각 제출한 결과, 점수가 다른 점을 확인 할 수 있다. 이는 RandomSerachCV에서 설정한 param_distributions 에 사용된 값들이 랜덤한 범위 내에서 사용되었기 때문이다.
더 높은 점수를 확보하기 위해 RandomSearchCV의 max depth를 np.random.randint(3, 20, 10)으로, max_features를 np.random.uniform(0.7, 1, 10)으로 탐색 범위를 더 넓혀주고 다시 실행하였다.

변경 후 실행을 하고 제출한 결과 점수가 눈에 띄게 개선된 모습을 확인할 수 있다.
💡 EDA와 모델링에 대한 팁
- 피처를 추가하고 제외하는 것은 EDA 를 하고 적용해 보는 것도 중요하지만, 직접 모델에 추가하고 제거해 보면서 검증해 보는 것도 좋습니다.
House Prices 경진대회
제공하는 데이터셋에 있는 주택가격을 예측하기 위한 변수로는 내외관 품질, 화장실의 수, 방의 개수, 수영장 여부, 지붕, 언제 건축이 되었는지 등의 데이터가 있다. 이 데이터셋을 통해 EDA를 해보고 피처엔지니어링을 통해 어떤게 신호가 되고 어떤게 소음이 될지 알아보도록 한다. 여기에서는 우선 피처엔지니어링의 다양한 기법을 우선적으로 알아보자.
Feature Engineering을 위한 기초 개념
Feature Engineering의 분류
| 분류명 | 정의 |
|---|---|
| 특성 선택(Feature Selection) | 해당 분야(Domain) 전문가의 지식이나, 특성의 중요도(Feature Importance)에 따라 일부 특성을 선택함. |
| 특성 추출(Feature Extraction) | 특성들의 조합으로 아예 새로운 특성을 생성하는 것(파생변수) . 주성분 분석(PCA)와 같은 기법은 특성 추출에 해당 |
| 범위 변환(Scaling) | 변수의 분포가 편향되어 있을 경우(정규분포와 거리가 멀다), 이상치가 많이 존재할 경우 등 변수의 특성이 잘 드러나지 않고 활용하기 어려울 경우 변수의 범위를 바꾸어주는 작업 |
| 변형(Transform) | 기존에 존재하는 변수의 성질을 이용해 새로운 변수를 생성 |
| 범주화(Binning) | 연속형 변수를 범주형 변수로 변환하는 것 ex) 예를 들어 20~29세까지의 데이터를 20대로 묶는 것 |
| 숫자화(Dummy) | 범주형 변수를 연속형 변수로 변환하는 것입니다. Categorical Feature를 Numerical Feature로 바꾸는 것. |
Feature의 종류
| 타입 | 서브타입 | 정의 | 예시 |
|---|---|---|---|
| Categorical | Nominal | 여러 가지로 나뉘고 자연적인 순서가 없는 범주형 변수 | 성별, 음료수 종류 |
| Ordinal | 여러 가지로 나뉘고 자연적인 순서가 있는 범주형 변수 | 성적, 등급 | |
| Numerical | Discrete | 유한하거나 개수를 헤아릴 수 있는 숫자형 변수 | 물건의 개수, 행동의 횟수 |
| Continuous | 무한하거나 개수를 헤아릴 수 없는 숫자형 변수 | 물건의 가격, 시간 |
데이터셋 호출
#라이브러리 호출
import pandas as pd
import numpy as np
import matplotlib.pyplot as plt
import seaborn as sns

plt.style.use("ggplot")

# 경로설정
# base_path는 본인이 받은 데이터의 폴더 위치를 확인 후 맞게 변경시켜주면 된다.
base_path = "data/"

# 데이터 변수 할당
train = pd.read_csv(f"{base_path}/train.csv", index_col = "Id")
test = pd.read_csv(f"{base_path}/test.csv", index_col = "Id")
sub = pd.read_csv(f"{base_path}/sample_submission.csv", index_col = "Id")
데이터 탐색
train.info()
-
결과값
  <class 'pandas.core.frame.DataFrame'>
  Int64Index: 1460 entries, 1 to 1460
  Data columns (total 80 columns):
   #   Column         Non-Null Count  Dtype
  ---  ------         --------------  -----
   0   MSSubClass     1460 non-null   int64
   1   MSZoning       1460 non-null   object
   2   LotFrontage    1201 non-null   float64
   3   LotArea        1460 non-null   int64
   4   Street         1460 non-null   object
   5   Alley          91 non-null     object
   6   LotShape       1460 non-null   object
   7   LandContour    1460 non-null   object
   8   Utilities      1460 non-null   object
   9   LotConfig      1460 non-null   object
   10  LandSlope      1460 non-null   object
   11  Neighborhood   1460 non-null   object
   12  Condition1     1460 non-null   object
   13  Condition2     1460 non-null   object
   14  BldgType       1460 non-null   object
   15  HouseStyle     1460 non-null   object
   16  OverallQual    1460 non-null   int64
   17  OverallCond    1460 non-null   int64
   18  YearBuilt      1460 non-null   int64
   19  YearRemodAdd   1460 non-null   int64
   20  RoofStyle      1460 non-null   object
   21  RoofMatl       1460 non-null   object
   22  Exterior1st    1460 non-null   object
   23  Exterior2nd    1460 non-null   object
   24  MasVnrType     1452 non-null   object
   25  MasVnrArea     1452 non-null   float64
   26  ExterQual      1460 non-null   object
   27  ExterCond      1460 non-null   object
   28  Foundation     1460 non-null   object
   29  BsmtQual       1423 non-null   object
   30  BsmtCond       1423 non-null   object
   31  BsmtExposure   1422 non-null   object
   32  BsmtFinType1   1423 non-null   object
   33  BsmtFinSF1     1460 non-null   int64
   34  BsmtFinType2   1422 non-null   object
   35  BsmtFinSF2     1460 non-null   int64
   36  BsmtUnfSF      1460 non-null   int64
   37  TotalBsmtSF    1460 non-null   int64
   38  Heating        1460 non-null   object
   39  HeatingQC      1460 non-null   object
   40  CentralAir     1460 non-null   object
   41  Electrical     1459 non-null   object
   42  1stFlrSF       1460 non-null   int64
   43  2ndFlrSF       1460 non-null   int64
   44  LowQualFinSF   1460 non-null   int64
   45  GrLivArea      1460 non-null   int64
   46  BsmtFullBath   1460 non-null   int64
   47  BsmtHalfBath   1460 non-null   int64
   48  FullBath       1460 non-null   int64
   49  HalfBath       1460 non-null   int64
   50  BedroomAbvGr   1460 non-null   int64
   51  KitchenAbvGr   1460 non-null   int64
   52  KitchenQual    1460 non-null   object
   53  TotRmsAbvGrd   1460 non-null   int64
   54  Functional     1460 non-null   object
   55  Fireplaces     1460 non-null   int64
   56  FireplaceQu    770 non-null    object
   57  GarageType     1379 non-null   object
   58  GarageYrBlt    1379 non-null   float64
   59  GarageFinish   1379 non-null   object
   60  GarageCars     1460 non-null   int64
   61  GarageArea     1460 non-null   int64
   62  GarageQual     1379 non-null   object
   63  GarageCond     1379 non-null   object
   64  PavedDrive     1460 non-null   object
   65  WoodDeckSF     1460 non-null   int64
   66  OpenPorchSF    1460 non-null   int64
   67  EnclosedPorch  1460 non-null   int64
   68  3SsnPorch      1460 non-null   int64
   69  ScreenPorch    1460 non-null   int64
   70  PoolArea       1460 non-null   int64
   71  PoolQC         7 non-null      object
   72  Fence          281 non-null    object
   73  MiscFeature    54 non-null     object
   74  MiscVal        1460 non-null   int64
   75  MoSold         1460 non-null   int64
   76  YrSold         1460 non-null   int64
   77  SaleType       1460 non-null   object
   78  SaleCondition  1460 non-null   object
   79  SalePrice      1460 non-null   int64
  dtypes: float64(3), int64(34), object(43)
  memory usage: 923.9+ KB
info()를 확인한 결과, 결측치가 있는 columns들이 꽤나 있는 것을 확인하였다.
Histplot
train.hist(figsize = (20,10), bins = 50);
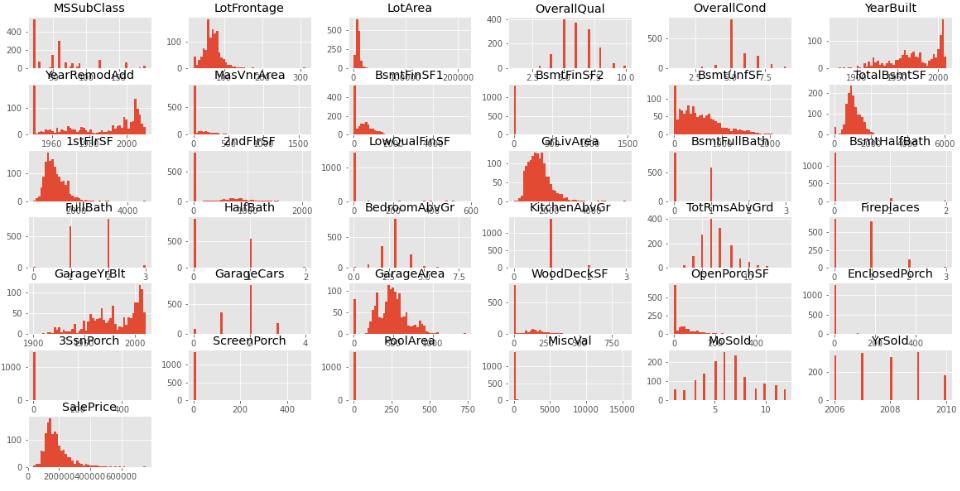
- 막대가 떨어져있는 범주형 값으로 보이는 자료가 많다.
- 2000년대에 지어진 집이 많다.
- YearRemodAdd의 데이터는 양극단에 몰려있다.
결측치 탐색
columns수가 많고 그만큼 결측치를 가진 columns가 많기에 아래와 같이 코드를 작성하여 결측치가 있는 columns만 확인한다.
train_null = train.isnull().sum()
train_sum = train_null[train_null > 0].sort_values(ascending = False)
-
결과값
  PoolQC          1453
  MiscFeature     1406
  Alley           1369
  Fence           1179
  FireplaceQu      690
  LotFrontage      259
  GarageType        81
  GarageYrBlt       81
  GarageFinish      81
  GarageQual        81
  GarageCond        81
  BsmtExposure      38
  BsmtFinType2      38
  BsmtFinType1      37
  BsmtCond          37
  BsmtQual          37
  MasVnrArea         8
  MasVnrType         8
  Electrical         1
  dtype: int64
test_null = test.isnull().sum()
test_sum = test_null[test_null > 0].sort_values(ascending = False)
-
결과값
  PoolQC          1456
  MiscFeature     1408
  Alley           1352
  Fence           1169
  FireplaceQu      730
  LotFrontage      227
  GarageCond        78
  GarageYrBlt       78
  GarageQual        78
  GarageFinish      78
  GarageType        76
  BsmtCond          45
  BsmtExposure      44
  BsmtQual          44
  BsmtFinType1      42
  BsmtFinType2      42
  MasVnrType        16
  MasVnrArea        15
  MSZoning           4
  BsmtFullBath       2
  BsmtHalfBath       2
  Functional         2
  Utilities          2
  GarageCars         1
  GarageArea         1
  TotalBsmtSF        1
  KitchenQual        1
  BsmtUnfSF          1
  BsmtFinSF2         1
  BsmtFinSF1         1
  Exterior2nd        1
  Exterior1st        1
  SaleType           1
  dtype: int64
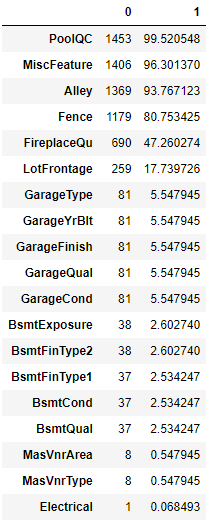
결측치의 합계와 비율을 한눈에 보기 위해서 concat 기능을 사용하기로 하였다.
train_na_mean = train.isnull().mean() * 100
pd.concat([train_null, train_na_mean], axis = 1).loc[train_sum.index]
- 결과값
test_na_mean = test.isnull().mean() * 100
pd.concat([test_null, test_na_mean], axis = 1).loc[test_sum.index]
- 결과값

이상치 탐색
이상치가 학습을 방해한다는 의미가 무엇일까? ⇒ 이상치로 인해 일반화가 어려워 지는 것
우선 우리가 제출해야할 SalePrice의 이상치를 확인해보록 하자.
train["SalePrice"].describe()

결과값 :
count      1460.000000
mean     180921.195890
std       79442.502883
min       34900.000000
25%      129975.000000
50%      163000.000000
75%      214000.000000
max      755000.000000
Name: SalePrice, dtype: float64

sns.scatterplot(data = train, x = train.index, y = "SalePrice")
plt.axhline(500000, c = "k", ls = ":")
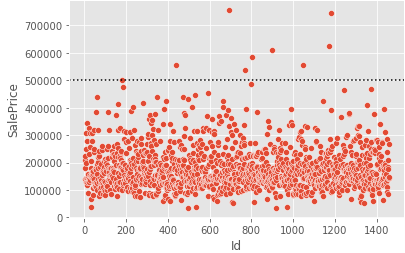
SalePrice의 500000이상을 보면 튀는 값들을 확인할 수 있다.
희소값 탐색
- 희소값이 발생하는 이유 : 데이터를 수집하다 보면 자연스럽게 비율이 높은 값과 낮은 값이 발생한다.
- 희소값을 찾는 이유
- 데이터 해석을 어렵게 하고, 머신러닝의 성능을 낮추는 요인
- 중요한 것은 전체 데이터의 경향을 파악
- 희소값이 많으면 경향을 파악하기가 어려움
- 희소값을 찾아서 적절히 처리함으로써 전체 경향이 더 뚜렷하게 만들 수 있다.
train data set에서 object 타입인 columns의 nunique 값을 10개만 호출하기로 한다.
train.select_dtypes(include = "object").nunique().nlargest(10)

결과값 :
Neighborhood    25
Exterior2nd     16
Exterior1st     15
Condition1       9
SaleType         9
Condition2       8
HouseStyle       8
RoofMatl         8
Functional       7
RoofStyle        6
dtype: int64
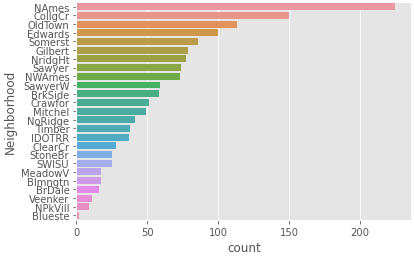
Neighborhood가 가장 크기 때문에 Neighborhood에 value_counts()기능을 활용하여 어떤 값이 있는지 확인해준다.
# Neighborhood - value_counts
ncounts = train["Neighborhood"].value_counts()
ncounts
-
결과값
  NAmes      225
  CollgCr    150
  OldTown    113
  Edwards    100
  Somerst     86
  Gilbert     79
  NridgHt     77
  Sawyer      74
  NWAmes      73
  SawyerW     59
  BrkSide     58
  Crawfor     51
  Mitchel     49
  NoRidge     41
  Timber      38
  IDOTRR      37
  ClearCr     28
  StoneBr     25
  SWISU       25
  MeadowV     17
  Blmngtn     17
  BrDale      16
  Veenker     11
  NPkVill      9
  Blueste      2
  Name: Neighborhood, dtype: int64
나타낸 value들을 시각화해서 보기로 한다.
# countplot
sns.countplot(data = train, y = "Neighborhood", order = ncounts.index )
