titanic 하이퍼파라미터 튜닝, Bike Shareing Demand 실습
지난 포스팅에서 이어짐
하이퍼파라미터 튜닝 - RandomSearchCV
모델의 적합한 파라미터 튜닝값을 알아보기 위해 RandomSearchCV를 사용하였다.
# RandomizedSearchCV 호출
from sklearn.model_selection import RandomizedSearchCV

# np.random.randint : 해당 범위 내 랜덤값을 정해줌
# np.random.uniform : 해당 범위 내 랜덤값을 중복되지 않는 수로 정해줌.

param_distributions = {"max_depth": np.random.randint(3, 100, 10),
                       "max_features": np.random.uniform(0, 1, 10)}

# n_iter : 해당 작업을 얼마나 반복할지 결정
clf = RandomizedSearchCV(estimator=model,
                         param_distributions=param_distributions,
                         n_iter=5,
                         n_jobs=-1,
                         random_state=42
                        )

clf.fit(X_train, y_train)
fit을 하여 최적의 파라미터 값을 알아본다.
best_model = clf.best_estimator_
best_model

결과값
RandomForestClassifier(max_depth=9, max_features=0.4723162098197786, n_jobs=-1,
                       random_state=42)
추가적으로 점수와 어떤 결과들이 있는지를 확인해본다.
# 최고의 점수값을 확인
clf.best_score_

결과값 : 0.826062394074446
# 파라미터 조사 결과를 df형태로 나타내고, rank 순으로 정렬.
pd.DataFrame(clf.cv_results_).sort_values("rank_test_score").head()
Best Estimator
# 데이터를 머신러닝 모델로 학습(fit)합니다.
# 데이터를 머신러닝 모델로 예측(predict)합니다.
best_model.fit(X_train, y_train)
제출
submit = pd.read_csv("data/titanic/gender_submission.csv")
file_name = f"{clf.best_score_}.csv"

submit["Survived"] = y_predict

submit.to_csv(file_name, index = False)
Bike Shareing Demand 실습
경진대회의 성격 파악하기
어떤 문제 종류? ⇒ 회귀
무엇을 예측? ⇒ 매 시간 빌려진 자전거의 수의 예측
- Demand가 들어간 경진대회는 대부분 수요에 대한 예측문제
데이터 확인하기
datetime - hourly date + timestamp
season -  1 = spring, 2 = summer, 3 = fall, 4 = winter
holiday - whether the day is considered a holiday
workingday - whether the day is neither a weekend nor holiday
weather - 1: Clear, Few clouds, Partly cloudy, Partly cloudy
2: Mist + Cloudy, Mist + Broken clouds, Mist + Few clouds, Mist
3: Light Snow, Light Rain + Thunderstorm + Scattered clouds, Light Rain + Scattered clouds
4: Heavy Rain + Ice Pallets + Thunderstorm + Mist, Snow + Fog
temp - temperature in Celsius
atemp - "feels like" temperature in Celsius
humidity - relative humidity
windspeed - wind speed
casual - number of non-registered user rentals initiated
registered - number of registered user rentals initiated
count - number of total rentals
0601
라이브러리 및 데이터 로드와 데이터 확인
# 라이브러리 로드

import pandas as pd
import numpy as np
import seaborn as sns
import matplotlib.pyplot as plt
# 데이터 로드 및 확인

train = pd.read_csv("data/bike/train.csv")
test = pd.read_csv("data/bike/test.csv")

print(train.shape, test.shape)
결과값 : (10886, 12) (6493, 9)

set(train.columns) - set(test.columns)
결과값 : {'casual', 'count', 'registered'}
확인 결과, 우리가 예측해야 하는 값은 count 인 것을 확인하였다. 하지만, casual과 registered 도 예측해야 하는 항목에 선정되어있다. 이 이후는 차후에 알아보도록 하겠다.
결측치 확인
train.info()

결과값 :
<class 'pandas.core.frame.DataFrame'>
RangeIndex: 10886 entries, 0 to 10885
Data columns (total 12 columns):
 #   Column      Non-Null Count  Dtype
---  ------      --------------  -----
 0   datetime    10886 non-null  object
 1   season      10886 non-null  int64
 2   holiday     10886 non-null  int64
 3   workingday  10886 non-null  int64
 4   weather     10886 non-null  int64
 5   temp        10886 non-null  float64
 6   atemp       10886 non-null  float64
 7   humidity    10886 non-null  int64
 8   windspeed   10886 non-null  float64
 9   casual      10886 non-null  int64
 10  registered  10886 non-null  int64
 11  count       10886 non-null  int64
dtypes: float64(3), int64(8), object(1)
memory usage: 1020.7+ KB
test.info()

결과값 :
<class 'pandas.core.frame.DataFrame'>
RangeIndex: 6493 entries, 0 to 6492
Data columns (total 9 columns):
 #   Column      Non-Null Count  Dtype
---  ------      --------------  -----
 0   datetime    6493 non-null   object
 1   season      6493 non-null   int64
 2   holiday     6493 non-null   int64
 3   workingday  6493 non-null   int64
 4   weather     6493 non-null   int64
 5   temp        6493 non-null   float64
 6   atemp       6493 non-null   float64
 7   humidity    6493 non-null   int64
 8   windspeed   6493 non-null   float64
dtypes: float64(3), int64(5), object(1)
memory usage: 456.7+ KB
train.isnull().sum()

결과값 :
datetime      0
season        0
holiday       0
workingday    0
weather       0
temp          0
atemp         0
humidity      0
windspeed     0
casual        0
registered    0
count         0
dtype: int64
test.isnull().sum()

결과값 :
datetime      0
season        0
holiday       0
workingday    0
weather       0
temp          0
atemp         0
humidity      0
windspeed     0
dtype: int64
train.describe()

확인 결과
- casual,registered,count 평균값에 비해 max값이 크다
- datetime이 object 형식
- 풍속과 습도가 0인 날이 포함
전처리
날짜를 연, 월, 일, 분, 초로 나누는 파생변수를 만든다.
# "datetime" column의 type을 datetime으로 변환한다.
train["datetime"] = pd.to_datetime(train["datetime"])

train["year"] = train["datetime"].dt.year
train["month"] = train["datetime"].dt.month
train["day"] = train["datetime"].dt.day
train["hour"] = train["datetime"].dt.hour
train["minute"] = train["datetime"].dt.minute
train["second"] = train["datetime"].dt.second

train.head(2)

EDA
히스토그램으로 전반적인 분포를 파악한다.
# train의 histogram

train.hist(figsize = (12,10), bins = 50);
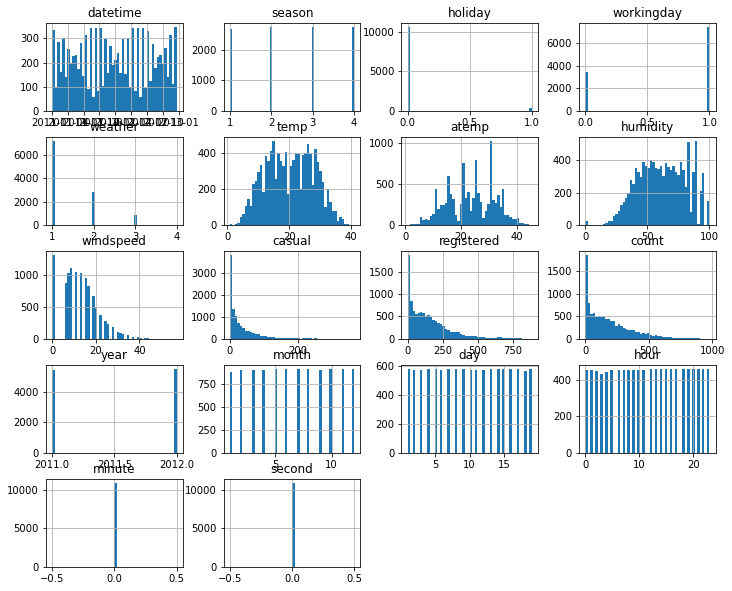
- windspeed에 0이 많으며, 습도에도 0이 존재.
- 날씨의 경우, 맑은 날(1)이 제일 많은 것으로 파악.
- minute과 second는 0으로 존재.
- 우리가 예측하려는 count 값은 0이 대부분.
# test의 histogram
test.hist(figsize = (12,10), bins = 50);
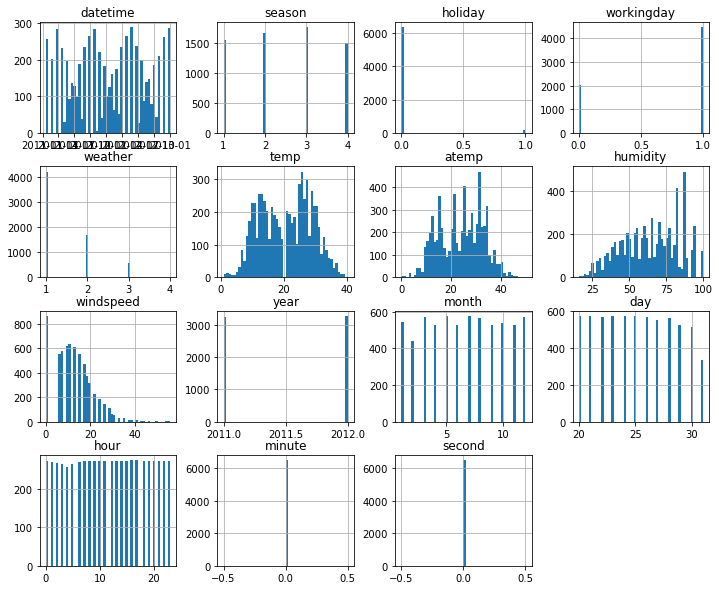
- year의 분포가 train과 다른 형태를 띄고 있으며, 20의 값이 존재하지 않음.
- windspeed에서 0의 값이 굉장히 높은 분포를 띔.
데이터들의 시각화를 통한 분석
train[train["windspeed"] == 0].shape

결과값 :
(1313, 18)

# 풍속과 대여량의 시각화
sns.scatterplot(data = train, x = "windspeed", y = "count")
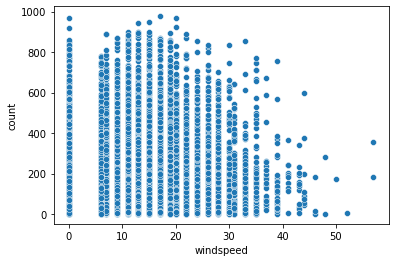
- 풍속의 값이 연속적으로 이어지는 것이 아닌, 범주형처럼 나뉘어지는 구간이 있어보인다.
# 풍속과 대여량의 시각화
sns.scatterplot(data = train, x = "humidity", y = "count")
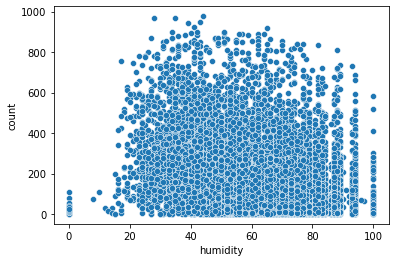
- 여기에서는 0으로 된 값이 많아 보이지는 않으며, 습도와 자전거 대여량은 상관이 없어 보인다.
# 온도와 체감온도의 시각화
sns.scatterplot(data = train, x = "temp", y = "atemp")
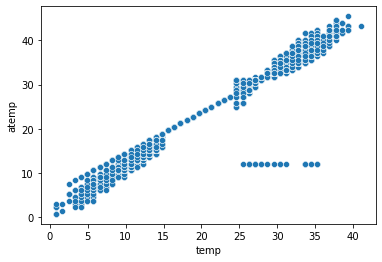
- 온도와 체감온도는 강력한 양의 상관관계
- 오류 데이터가 존재하는 것으로 판단됨.
# 이상치 찾기

train[(train["temp"] > 20) & (train["temp"] < 40) & (train["atemp"] < 15)]
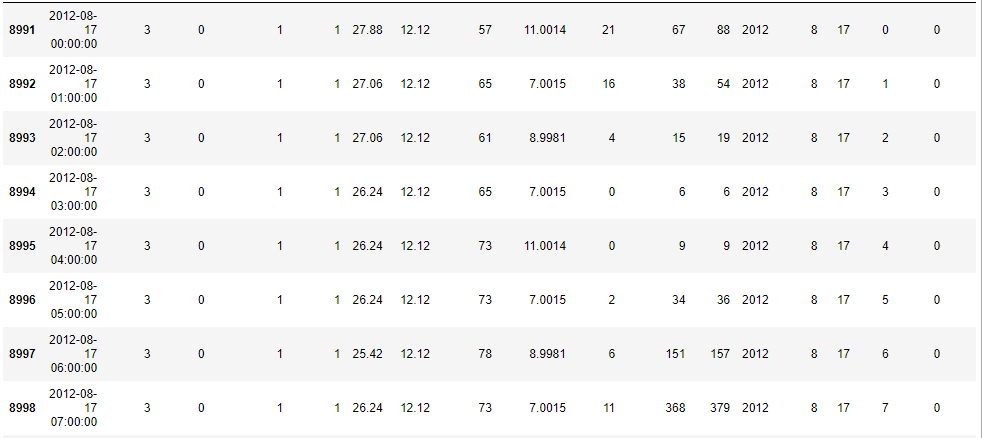
12년 8월 17일에 체감온도가 12.12도로 고정된 날짜들이 존재한다. 센서 고장 의심.
# 날씨에 따른 평균 자전거 대여수
# ci = 에러바 표시유무. 버전에 따라 해당 명령어는 다르게 표기되니 확인할 필요가 있다.

sns.barplot(data = train, x = "weather", y = "count", ci = None)

- 폭우 폭설이 내리는 날(4)이 비가 오는 날(3)보다 대여량이 많게 측정되었다.
날씨 4의 데이터를 확인해보기로 한다.
train[train["weather"] == 4]

확인한 결과 폭우와 폭설이 내리는 경우의 데이터는 단 하나만 존재하는 것을 확인하였다.
학습, 예측 데이터 만들기
# label_name : 정답값
label_name = "count"

# feature_names : 학습, 예측에 사용할 컬럼명(변수)
# train columns 중 count, datetime, casual, registered 항목이 test에 없기 제외한다.
feature_names = train.columns.tolist()
feature_names.remove(label_name)
feature_names.remove("datetime")
feature_names.remove("casual")
feature_names.remove("registered")

# 학습(훈련)에 사용할 데이터셋 예) 시험의 기출문제
X_train = train[feature_names]

# 예측 데이터셋, 예) 실전 시험 문제
X_test = test[feature_names]

# 학습(훈련)에 사용할 정답값 예) 기출문제의 정답
y_train = train[label_name]
머신러닝 알고리즘
회귀 유형이므로 RandomForestRegressor를 사용한다.
from sklearn.ensemble import RandomForestRegressor

model = RandomForestRegressor(random_state= 42, n_jobs = -1)
교차검증
# 모의고사를 풀어서 답을 구하는 과정과 유사합니다.
# cross_val_predict는 예측한 predict값을 반호나하여 직접 계산해 볼 수 있습니다.
# 다른 cross_val_score, cross_validate는 스코어를 조각마다 직접 계산해서 반환해줍니다.

from sklearn.model_selection import cross_val_predict

y_valid_pred = cross_val_predict(model, X_train, y_train, cv = 5, n_jobs = -1, verbose=2)
y_valid_pred

결과값 :
array([ 74.45,  65.47,  44.94, ..., 165.29, 152.17,  84.65])
평가
각종 평가수식으로 평가를 진행하였다. MAE, MSE, RMSE에 대한 자세한 사항은 10/31일자 내용을 확인하도록 하자.
**MAE(Mean Absolute Error)**
mae = abs(y_train - y_valid_pred).mean()
결과값 : 50.40957652030154

# sklearn에서도 똑같이 mad를 구할 수 있다.
from sklearn.metrics import mean_absolute_error
mean_absolute_error(y_train, y_valid_pred)
결과값 : 50.40957652030131
MSE(Mean Squared Error)
# MSE(Mean Squared Error)
mse = np.square(y_train - y_valid_pred).mean()
결과값 : 5757.8679269795975

from sklearn.metrics import mean_squared_error
mean_squared_error(y_train, y_valid_pred)
결과값 : 5757.867926979607
**RMSE(Root Mean Squared Error)**
# RMSE(Root Mean Squared Error)
RMSE = np.sqrt(mse)
결과값 : 75.88061627965074
**RMSLE(Root Mean Squared Logarithm**
- $\sqrt{\frac{1}{n} \sum_{i=1}^n (\log(p_i + 1) - \log(a_i+1))^2 }$
- 각 log마다 1을 더하는 이유 : 정답에 +1을 해서 1보다 작은 값이 있을 때 마이너스 무한대로 수렴하는 것을 방지
-
로그를 취하면 skewed 값이 덜 skewed(찌그러지게) 하게 된다. 또한, 스케일 범위값이 줄어드는 효과를 볼 수 있다.
  sns.kdeplot(y_train)
  sns.kdeplot(y_valid_pred)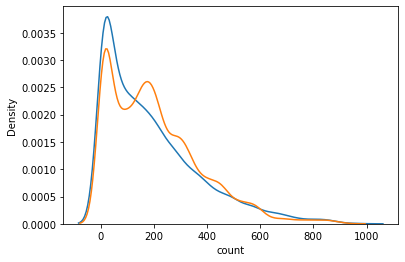
sns.kdeplot(np.log(train["count"]+1))
- 또한, 분포가 좀 더 정규분포에 가까워지기도 한다
- RMSLE는 RMSE 와 거의 비슷하지만 오차를 구하기 전에 예측값과 실제값에 로그를 취해주는 것만 다르다.
# RMSLE 계산

(((np.log1p(y_train) - np.log1p(y_valid_pred)) **2).mean()) ** (1/2)
결과값 : 0.5200652012443514

from sklearn.metrics import mean_squared_log_error
(mean_squared_log_error(y_train, y_valid_pred)) **(1/2)
결과값 : 0.5200652012443514
학습 및 제출
y_predict = model.fit(X_train, y_train).predict(X_test)
제출할 파일명에는 계산한 RMSLE의 값이 들어간 파일을 제출하여 구분하기 쉽도록 하였다.

점수를 더 올려보기 위해서 피처를 조정하기로 한다.
feature_names = train.columns.tolist()
feature_names.remove(label_name)
feature_names.remove("datetime")
feature_names.remove("casual")
feature_names.remove("registered")
feature_names.remove('month')
feature_names.remove('day')
feature_names.remove('second')
feature_names.remove('minute')
feature_names

결과값 :
['season',
 'holiday',
 'workingday',
 'weather',
 'temp',
 'atemp',
 'humidity',
 'windspeed',
 'year',
 'hour']
피처를 조정(day, month, second, minute 제외) 후 동일한 방법을 진행 후 케글에 제출하고 점수를 확인하였다.

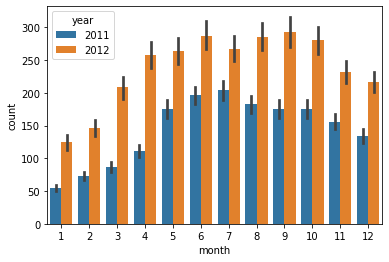
점수가 상향한 모습을 볼 수 있다. second와 minute는 값이 0이기에 제외하고, day 는 train 에는 1~19일 test 에는 20~말일까지 있기 때문에 학습한 것이 예측에 도움지 않기 때문에 제외를 한다. (위가 train set, 아래가 test set)
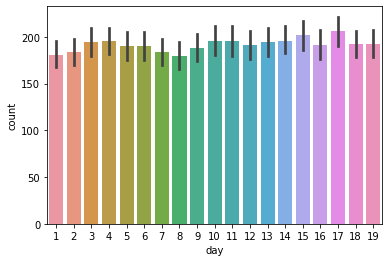
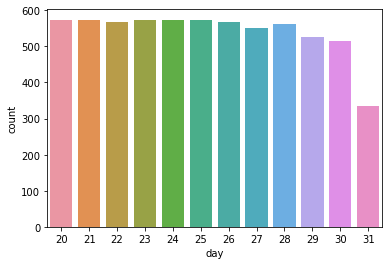
month의 경우, 달에 따라 count 값이 영향을 받는 거 같지만 2011년과 2012년의 동일 달을 비교 했을때 차이가 크기 때문에 삭제
